App store analytics refers to the systematic analysis of data collected from mobile app stores, such as Google Play and the Apple App Store, and the broader mobile app economy. Like mobile app analytics, app store analytics can be used for anything from market research to competitor analysis, but are more commonly leveraged by developers to monitor the success of their apps, improve app store optimization (ASO), and more.
At 42matters, we deliver app store analytics via a host of useful APIs and the 42matters Explorer. This includes insight into Google Play, the Apple App Store, Amazon Appstore, Tencent Appstore, and a variety of connected TV channel stores.
Previously, we wrote an article that answered one of the more frequently asked questions about the app ecosystem — what are mobile app analytics? In this article, we’ll seek to answer a related question. Namely, what are app store analytics and why do they matter?
As with the previous piece, we’ll cover the basics — why app store analytics matter, where to find them, and the most common app store insights. Then, we’ll get a little more precise and show you how to use the 42matters Explorer to get country-specific and category-specific app store analytics.
So, now that we’ve cleared our throats, let’s commence!
Why do app store analytics matter?
Once again, to echo our previous post on mobile app analytics, app store analytics enable businesses to make informed decisions that impact all departments — development, operations, sales, marketing, etc.
This is important because the mobile app economy is continuing to grow unabated. Currently, there are over two million app publishers and five million apps across the Apple App Store and Google Play — and vastly more when you account for the various other mobile app stores. Moreover, mobile advertising alone is projected to generate over 117 billion dollars in revenue in 2020.
This means two things. One, the mobile app economy is a tremendous opportunity for entrepreneurs, start-ups, established businesses, and everyone in between. Two, with so many publishers jockeying for position, any advantage could be the difference between success and irrelevance.
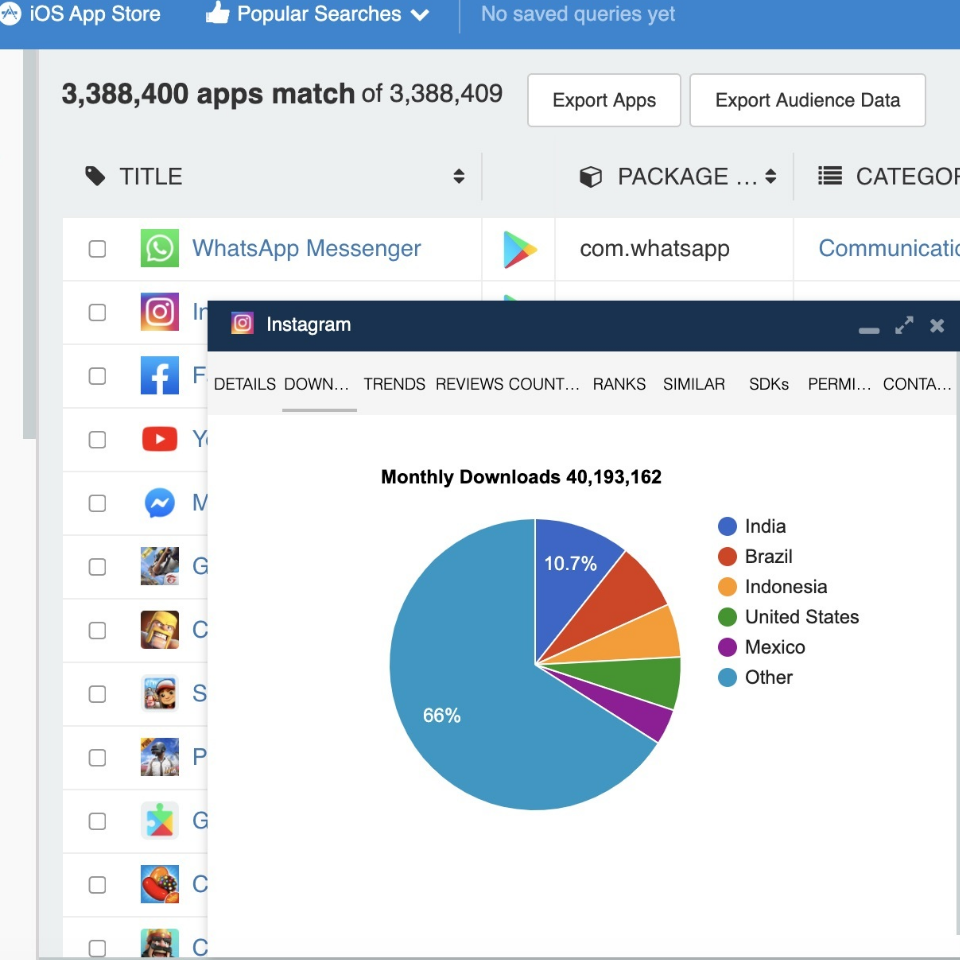
To put it frankly, there’s a low probability that any app will become the next Instagram. Still, app store analytics enable publishers to analyze trends in their market, identify target audiences, carve out a niche, and use those gains to increase market share and grow revenue.
Want to learn about how app store analytics can help you grow your business? Let’s chat.
Where to find app store analytics?
Generally, when one Googles app store analytics and insights, they’ll be inundated with a variety of articles on the broader category of mobile app data. This is decidedly not the same thing. Indeed, while both Apple and Google provide ways for developers to investigate the data collected by their own apps, and while a host of other platforms can offer folks similar app insights for apps that they do not own, getting one’s hands on aggregated data for app stores themselves is quite a bit more difficult.
Nevertheless, it can be achieved! And there are a number of great services that you can check out. But, since you’re here, you should begin with our side-by-side comparison of Google Play and the Apple App Store. Otherwise, if you’re interested in a particular app store, feel free to check out our store stats pages:
- Apple iOS App Store
- Apple TV App Store
- Amazon Appstore
- Amazon Fire TV
- Google Play
- Roku Channel Store
- Tencent Appstore
What are the most common app store analytics?
One of the more frustrating aspects of app store research is that it’s quite difficult to get a straight answer on even the most simple questions.
For instance, just Google something like “How many apps are there on the Apple app store?” Or “How many game publishers are there on Google Play?” Practically every website you open will have a different answer. Moreover, because these stores are nearly living, breathing organisms — with millions of developers uploading new apps, updating existing apps, and removing old apps every day — anywhere you do look is likely to be showing you expired data.
So, with that in mind, we thought we’d briefly run through some of the most common app store analytics questions. We’ll also provide answers for both Google Play and the Apple App Store, based on data collected on August 12th, 2020.
For the latest numbers, visit our store stats pages.
1. How many apps are there on Google Play? How many apps are there on the Apple App Store?
Not surprisingly, these are perhaps the two most frequently asked questions in the entire world of mobile apps. And for good reason! It’s an incredibly useful data point to reference in white papers, market research, etc.
As of August 12th, 2020, there were 3,387,931 apps on Google Play and 1,800,653 apps on the Apple App Store.
2. How many app publishers are there on Google Play? How many app publishers are there on the Apple App Store?
Along the same lines, determining the number of app publishers on the major app stores is a handy piece of data for market research.
As of August 12th, 2020, there were 754,840 apps on Google Play and 1,370,915 apps on the Apple App Store.
3. How many mobile games are there on Google Play? How many mobile games are there on the Apple App Store?
This is where things get a little more interesting. Drawing a distinction between mobile apps and mobile games provides insight into the growing vibrancy of the mobile gaming market.
As of August 12th, 2020, there were 433,271 (12.8%) mobile games on Google Play compared to 257,387 (14.3%) on the Apple App Store.
4. How many paid apps are there on Google Play? How many paid apps are there on the Apple App Store?
While the vast majority of apps are free, there are some that cost money to download. Such data, especially when paired with category insights, can provide valuable knowledge regarding monetization strategies — for instance, whether particular kinds of apps are more or less likely to be monetized.
As of August 12th, 2020, there were 118,960 (3.5%) paid apps on Google Play compared to 142,356 (7.9%) on the Apple App Store.
5. How many apps are there by category on Google Play? How many apps are there by category on the Apple App Store?
While app store insights are certainly useful for understanding the mobile app economy, most developers, and indeed most market researchers, are likely interested in acquiring data that’s more relevant to their business. If a developer builds finance apps, for instance, they’ll gain more actionable insights by looking at their direct competitors and the finance app market generally.
For this reason, it’s also important to take a look at the state of the individual app categories, genres, and IAB categories.
Here’s the breakdown of Android apps by category: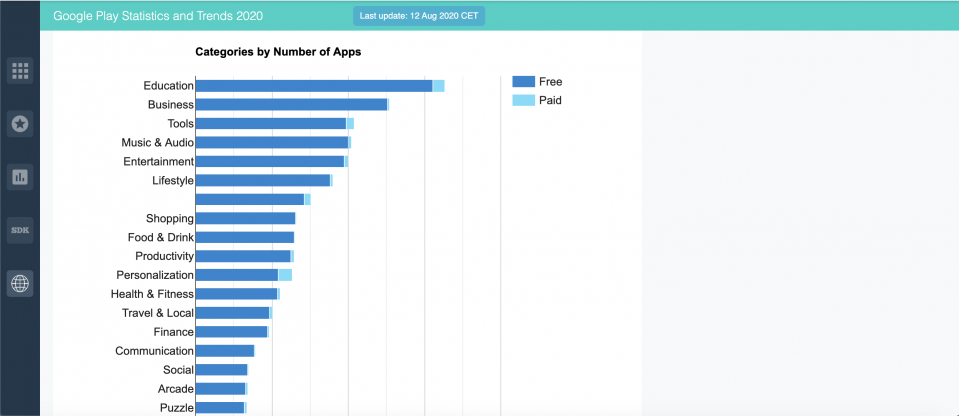
And iOS apps by genre: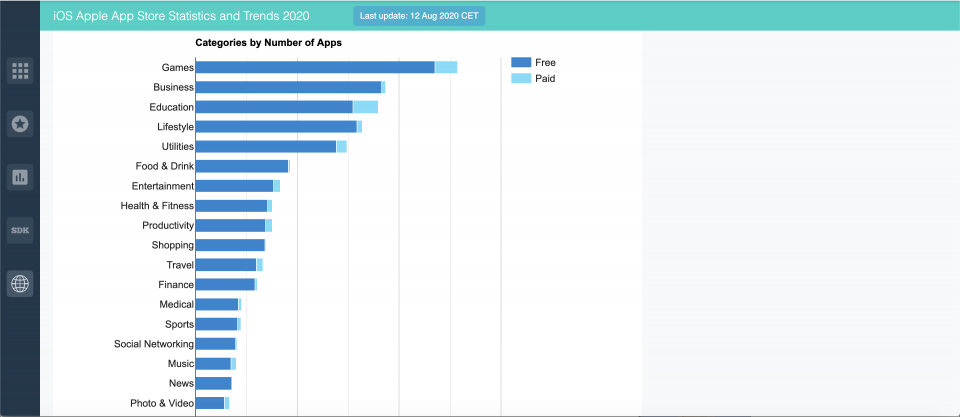
For more on app categories, visit our store stats pages.
6. How many apps are published per day/week/month on Google Play? How many apps are published per day/week/month on the Apple App Store?
As we alluded to previously, one reason most app store statistics you find online are bunk is that new apps are added every day. So, for your reference:
On Google Play, an average of 3,268 apps are added per day, 14,589 per week, and 115,901 per month.
For the Apple App Store, those numbers are 693 apps per day, 4,813 per week, and 27,089 per month.
Once again, these numbers were calculated on August 12, 2020. For the latest numbers, be sure to visit our site.
7. What is the average rating for Android apps? What is the average rating for iOS apps?
Like much of the data we’re discussing, the average app ratings on Google Play and the Apple App Store are only useful to an extent. Indeed, they are far more potent, when cross-referenced with another data point, such as category, downloads, monetization, etc.
Nevertheless, we’ve put together a number of histograms to demonstrate the rating distributions for some of the major app stores and connected TV channel stores.
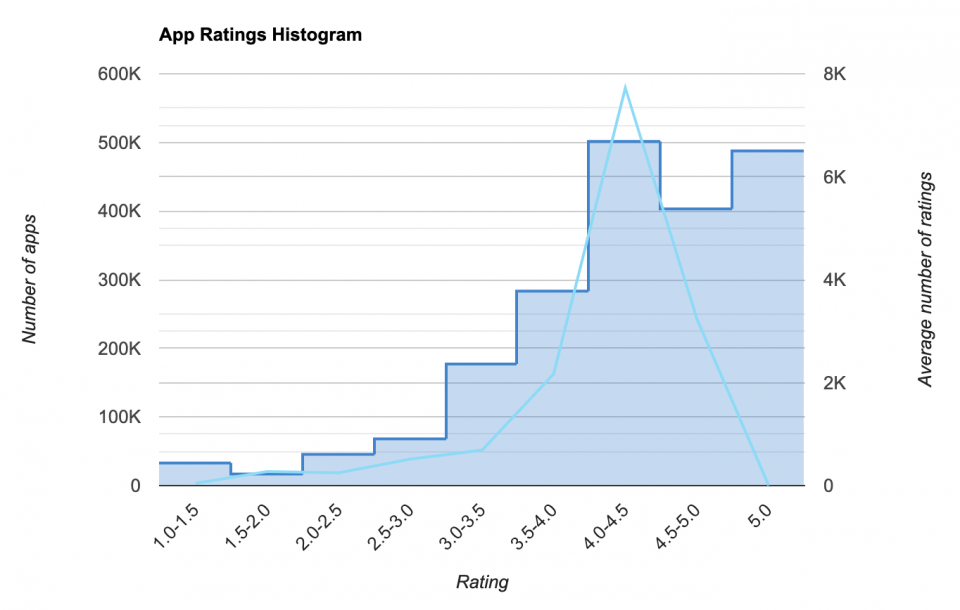
iOS: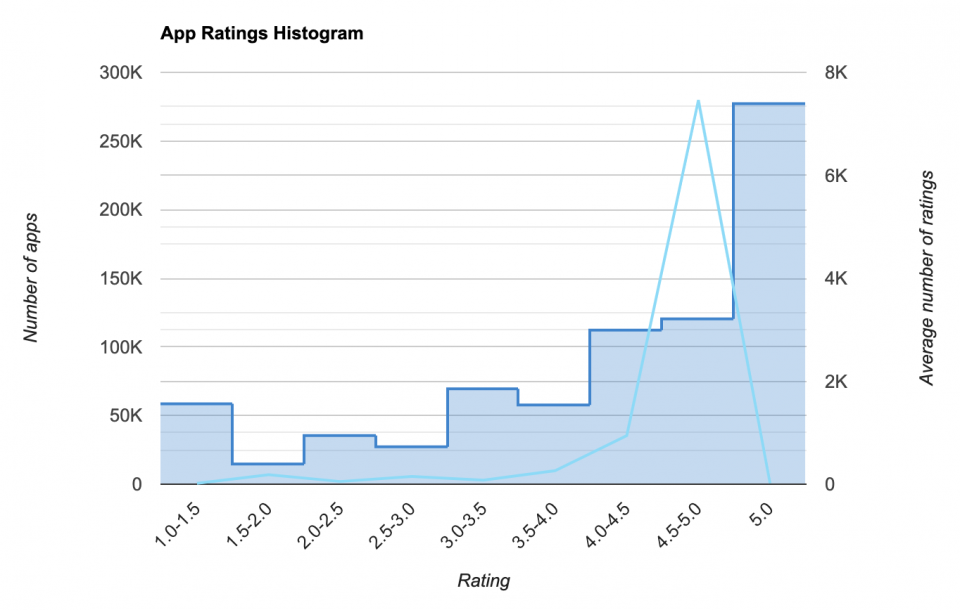
To see how ratings are distributed on the Android Appstore, Tencent Appstore, and others, visit our store stats pages.
8. What is the average price of Android apps? What is the average price of iOS apps?
Again, for most use cases, the average price of Android and iOS apps is far more enlightening when used to examine more granular market segments. Still, we’ve taken the liberty of generating charts that depict the price distribution for a variety of app stores and connected TV channel stores. Here are the big boys.
Android: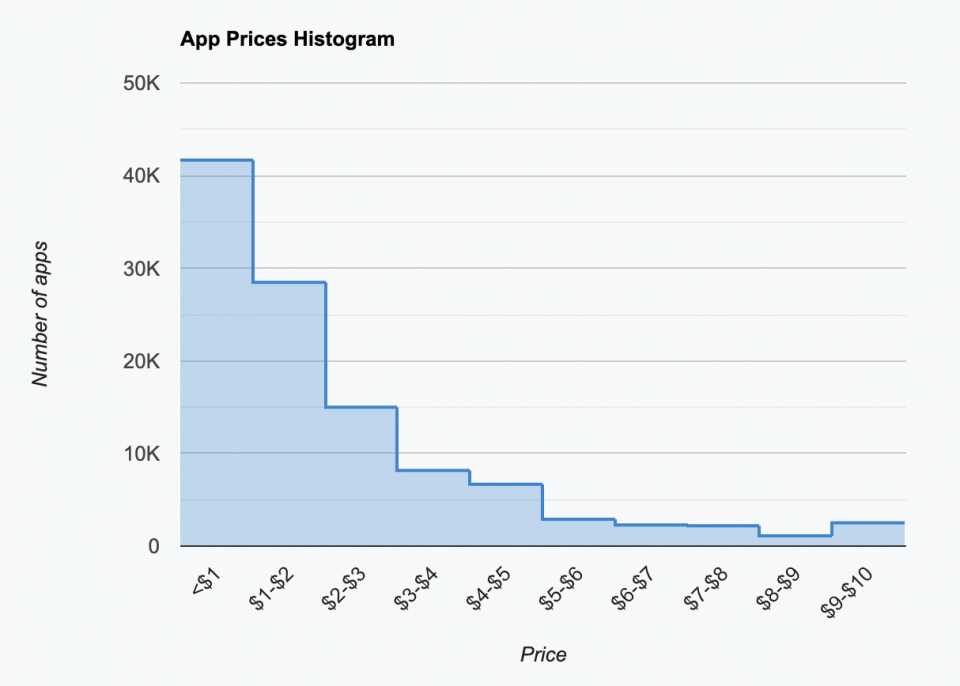
iOS: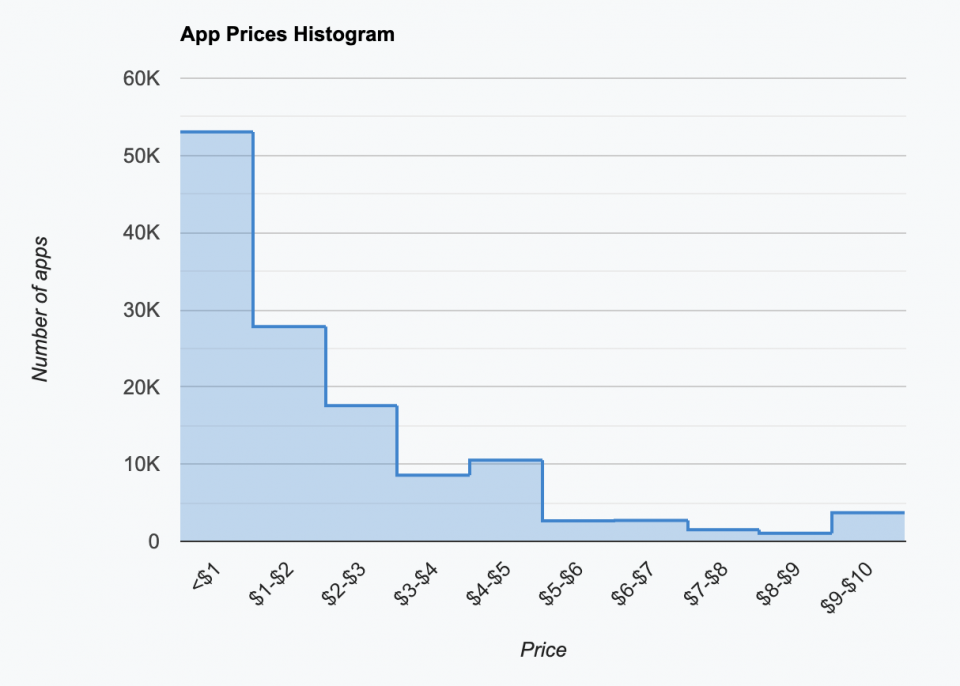
For the rest, you should take a look at our store stats pages.
How can 42matters help?
You may have noticed something of an ominous hue in those last few paragraphs — specifically regarding the utility of things like the “average rating” or the “average price” of apps on Google Play and the Apple App Store. And you would be correct. Indeed, fantastic as these insights may be for research purposes, they ultimately lack the precision that most app-centric businesses require for such things as ASO, competitor analysis, etc.
Please note, our app store stats pages are mostly for reference. If you want a quick overview of Google Play, the Apple App Store, Amazon Appstore, Tencent Appstore, Apple TV tvOS App Store, Amazon Fire, or the Roku Channel Store, they’re a good place to start.
That being said, to gather truly actionable information, you’ll need something with a little more horsepower. Something like the 42matters Explorer. Our flagship offering, the Explorer is an app market research tool that gives you access to highly granular app store analytics. This includes insight into:
- App categories, genres, IAB categories, and family categories
- Content ratings
- Rating trends and review analyses
- Monetization information (price, in-app purchases, and in-app advertising)
- Technology insights (SDKs, permissions, app-ads.txt compliance)
- Developer details
- Localization information
- And more!
To demonstrate the sort of app store analytics provided by the 42matters Explorer, we’ll briefly walk you through how to get country-specific and category-specific data. Furthermore, for each example, we will show you how to use our filters to generate ultra high-resolution information.
1. How to get country-specific app store analytics:
As mentioned above, things like “average price” or “average rating” are too broad for much practical application. In order to gain a more accurate understanding of your competition, you might want to take a look at local competitors.
With the 42matters Explorer, you can filter developers by their physical address, as well as where their products are available to download. For example, here are all developers based in Auckland, New Zealand whose apps are exclusively available in Australia and New Zealand: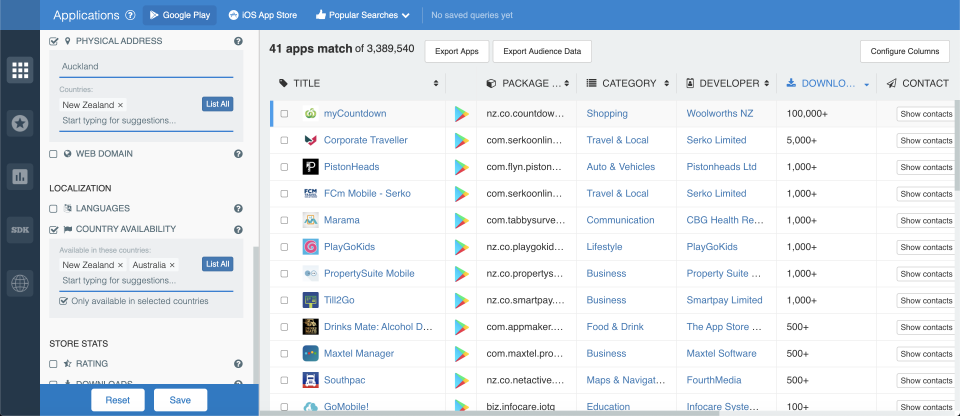
You can even go a bit further. For instance, you can add a category filter so that you get all Business apps that match the same parameters: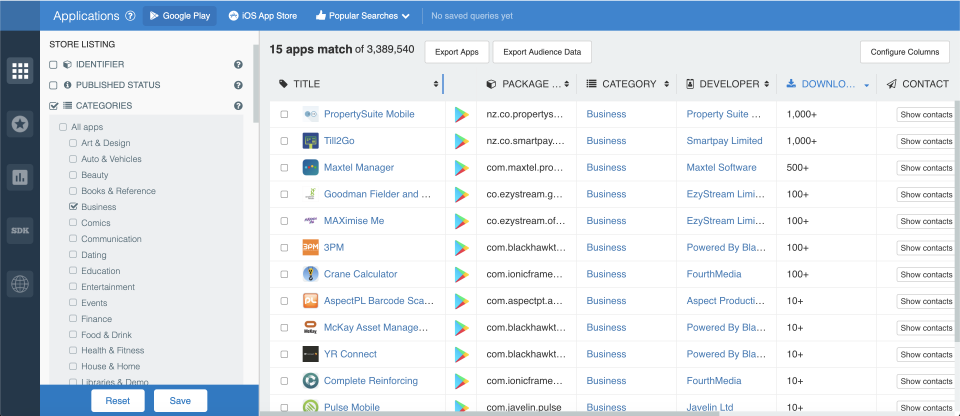
You can also include a technology filter, such as a permission, to see which apps use, for instance, the “ACCESS_FINE_LOCATION” permission: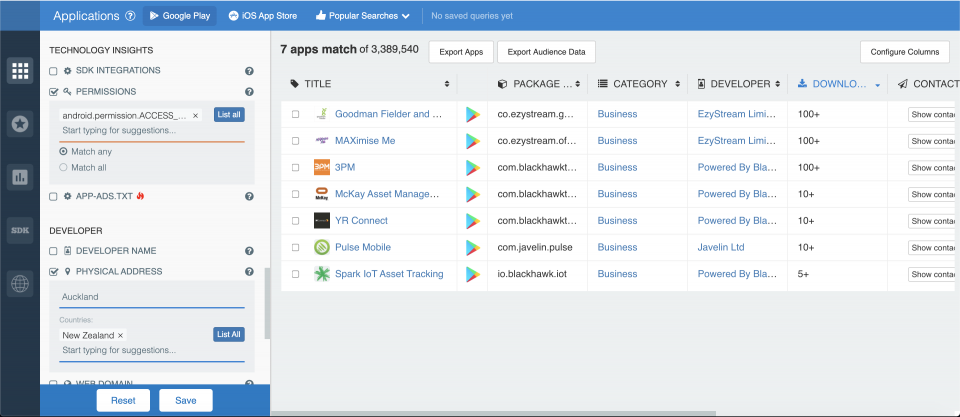
2. How to get category-specific app store analytics:
Similarly, you can begin your queries with specific categories. Let’s take a look at apps that fall into the Arcade game category: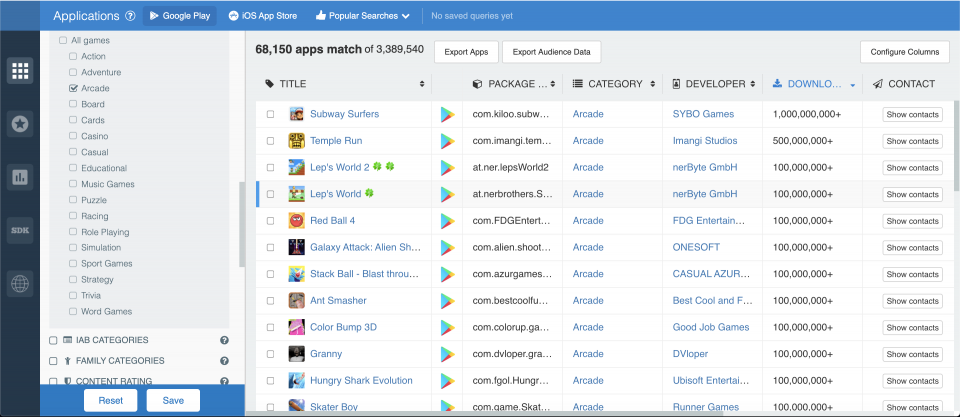
With the 42matters Explorer, you can figure out how these Arcade games are monetized. You can filter them based on whether they’re paid, free, or use custom price ranges; whether they contain in-app purchases; or whether they leverage in-app advertising. See here: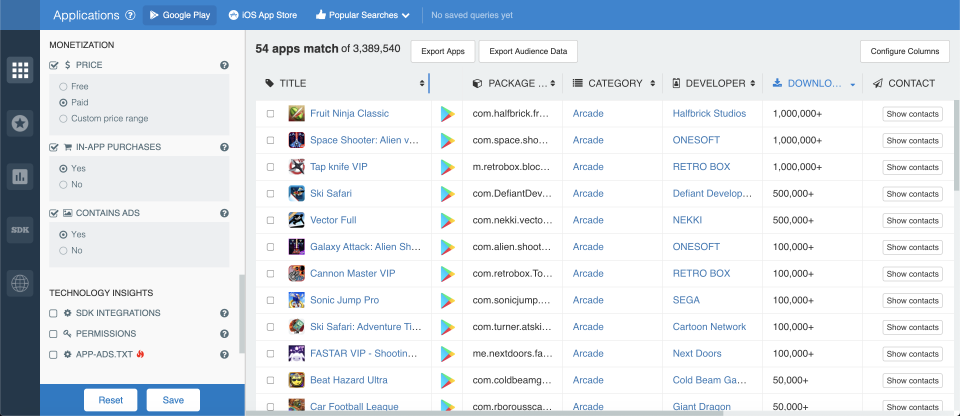
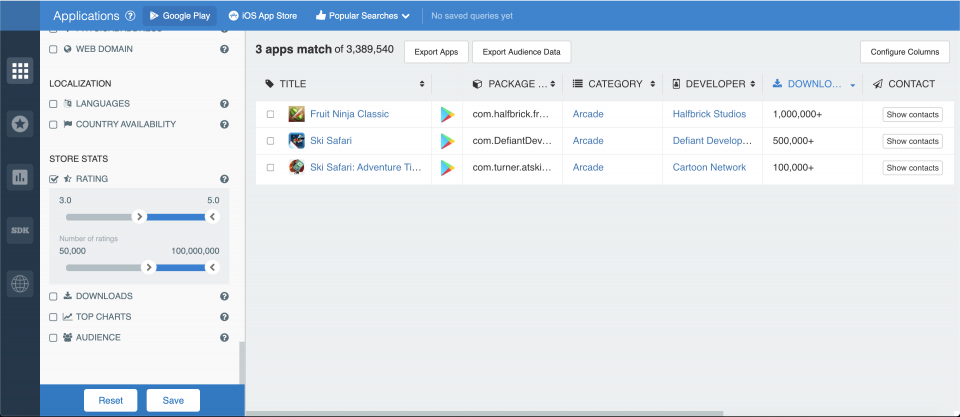
Then, you can winnow these results down even further by filtering for ratings and downloads. For instance, here are all games that fall into the Arcade category, which must be paid for, include in-app purchases and ads, have ratings above 3 stars and which have been downloaded more than 50,000 times:
How to get started with mobile app analytics...
The examples above are analogous to revving an engine in neutral — they show off what the platform can do without getting you past the starting line. So, if you have a specific use-case in mind and want to take the 42matters Explorer out for a spin, be sure to schedule a free demo with one of our experts. We’ll show you how they can improve your business!
Alternatively, for those more technically inclined, our APIs facilitate programmatic access to similar app store analytics. This includes data on many of the most popular mobile app stores and connected TV channel stores.
To learn more about app store analytics from 42matters, be sure to sign up for our newsletter.