After a disappointing earnings report, Netflix’s stock price collapsed. We take a look at how this has impacted their mobile app performance.
We’ve been keeping a close eye on the “Streaming Wars” lately. Just a few weeks ago, we analyzed Amazon’s $8.5B acquisition of MGM, as well as what the purchase could mean for Amazon’s ad business. We also released a report on the state of connected TV (CTV) app stores in 2022, in which we outlined the impressive growth of the Roku Channel Store, Apple TV tvOS App Store, Amazon Fire TV, Samsung Smart TV Apps, and the LG Content Store.
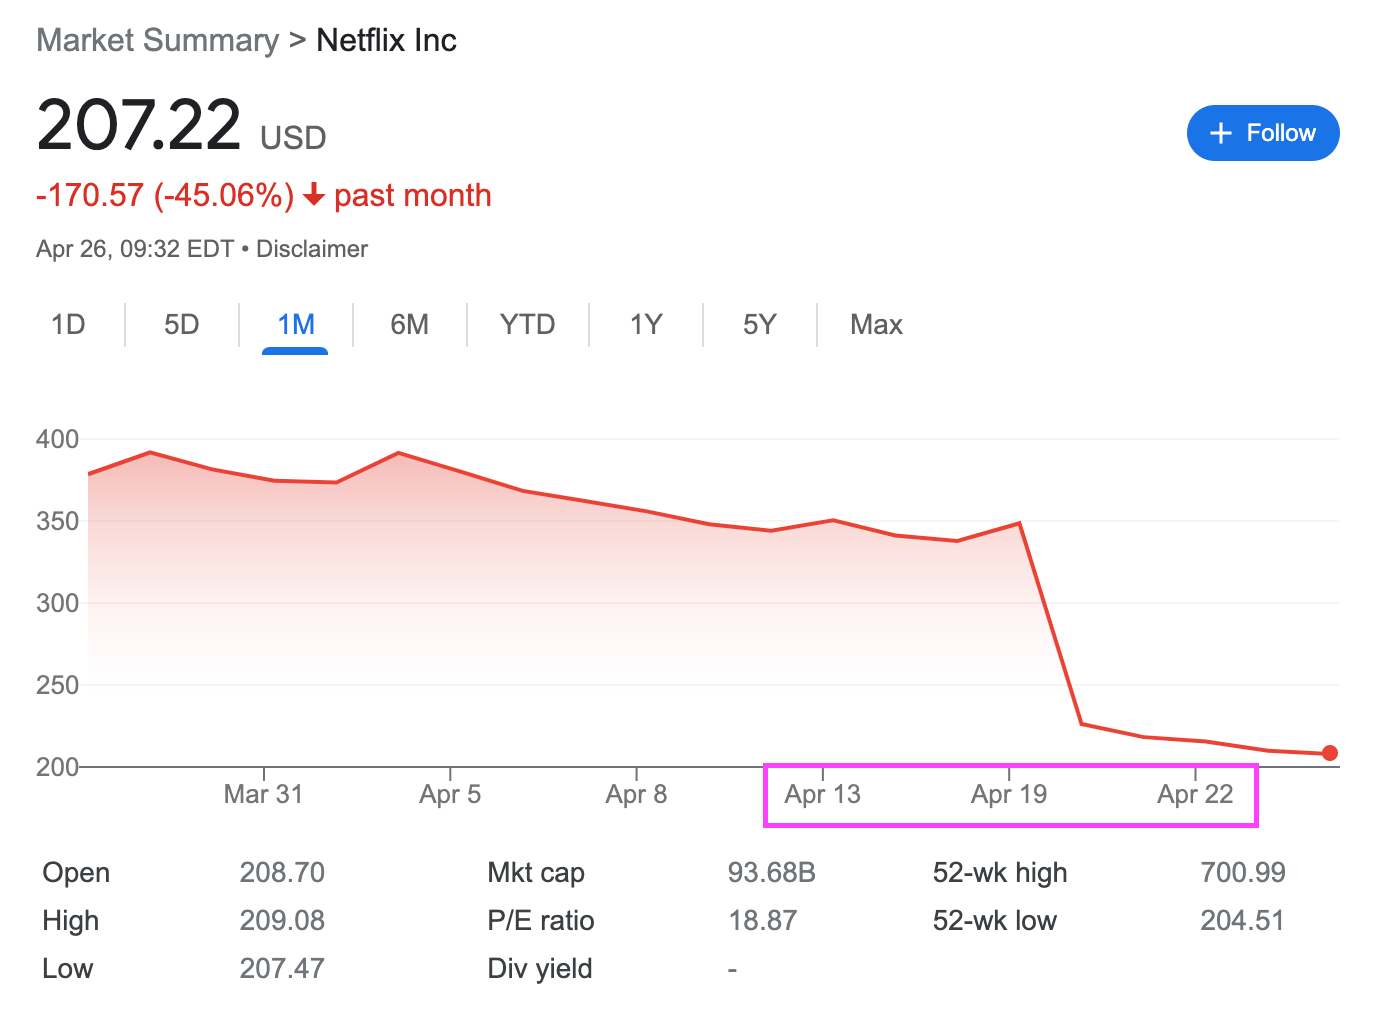
In this episode of the “Streaming Wars,” we turn our attention to Netflix. Still by far the most popular of the streaming platforms, the company was nevertheless rocked by an astonishing stock market collapse when prices fell from $348.61 to $226.19 overnight on April 20th. This was precipitated by an unsettling earnings report in which the company disclosed that it had lost some 200,000 subscribers in the first quarter of 2022, citing inflation, the war in Ukraine, and fierce competition as the primary causes.
Needless to say, many commentators — including the ever delightful Elon Musk — took to Twitter to opine on Netflix’s struggles. So, we thought we’d weigh in as well. We used our app intelligence solutions to analyze the performance of Netflix across the Apple App Store and Google Play.
In this article, we’ll cover (click the links below to jump to the relevant sections):
- Analysis of Netflix’s Performance
- Downloads (January 1st, 2022 - April 26th, 2022)
- Top Chart Rankings (January 1st, 2022 - April 26th, 2022)
- Final Thoughts
For more mobile video streaming app insights, set up a meeting with one of our experts!
Analysis of Netflix’s Performance
Let’s begin by taking a look at how the Netflix app has performed over the last 30 days. In particular, here’s an overview of the Android and iOS versions of Netflix from between March 27th, 2022 and April 26th, 2022:
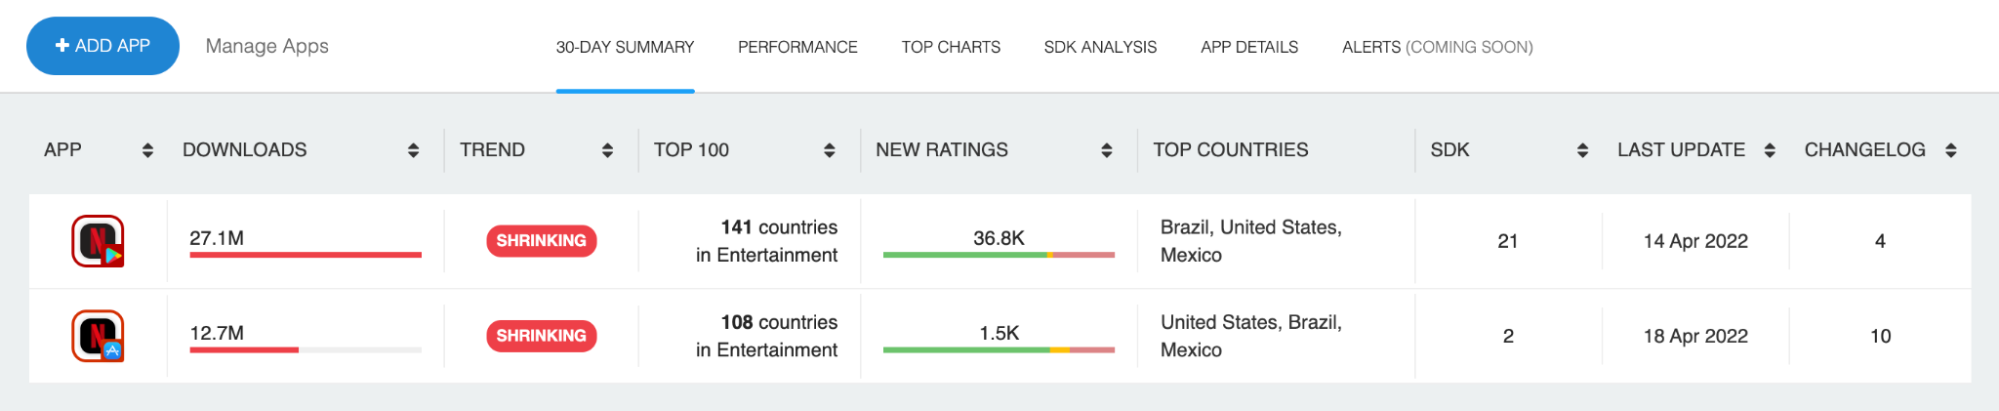
As you can see, Netflix has been downloaded 27,066,583 times via Google Play and 12,581,866 times via the Apple App Store.
For more context, let’s zoom out a bit…
Downloads (January 1st, 2022 - April 26th, 2022)
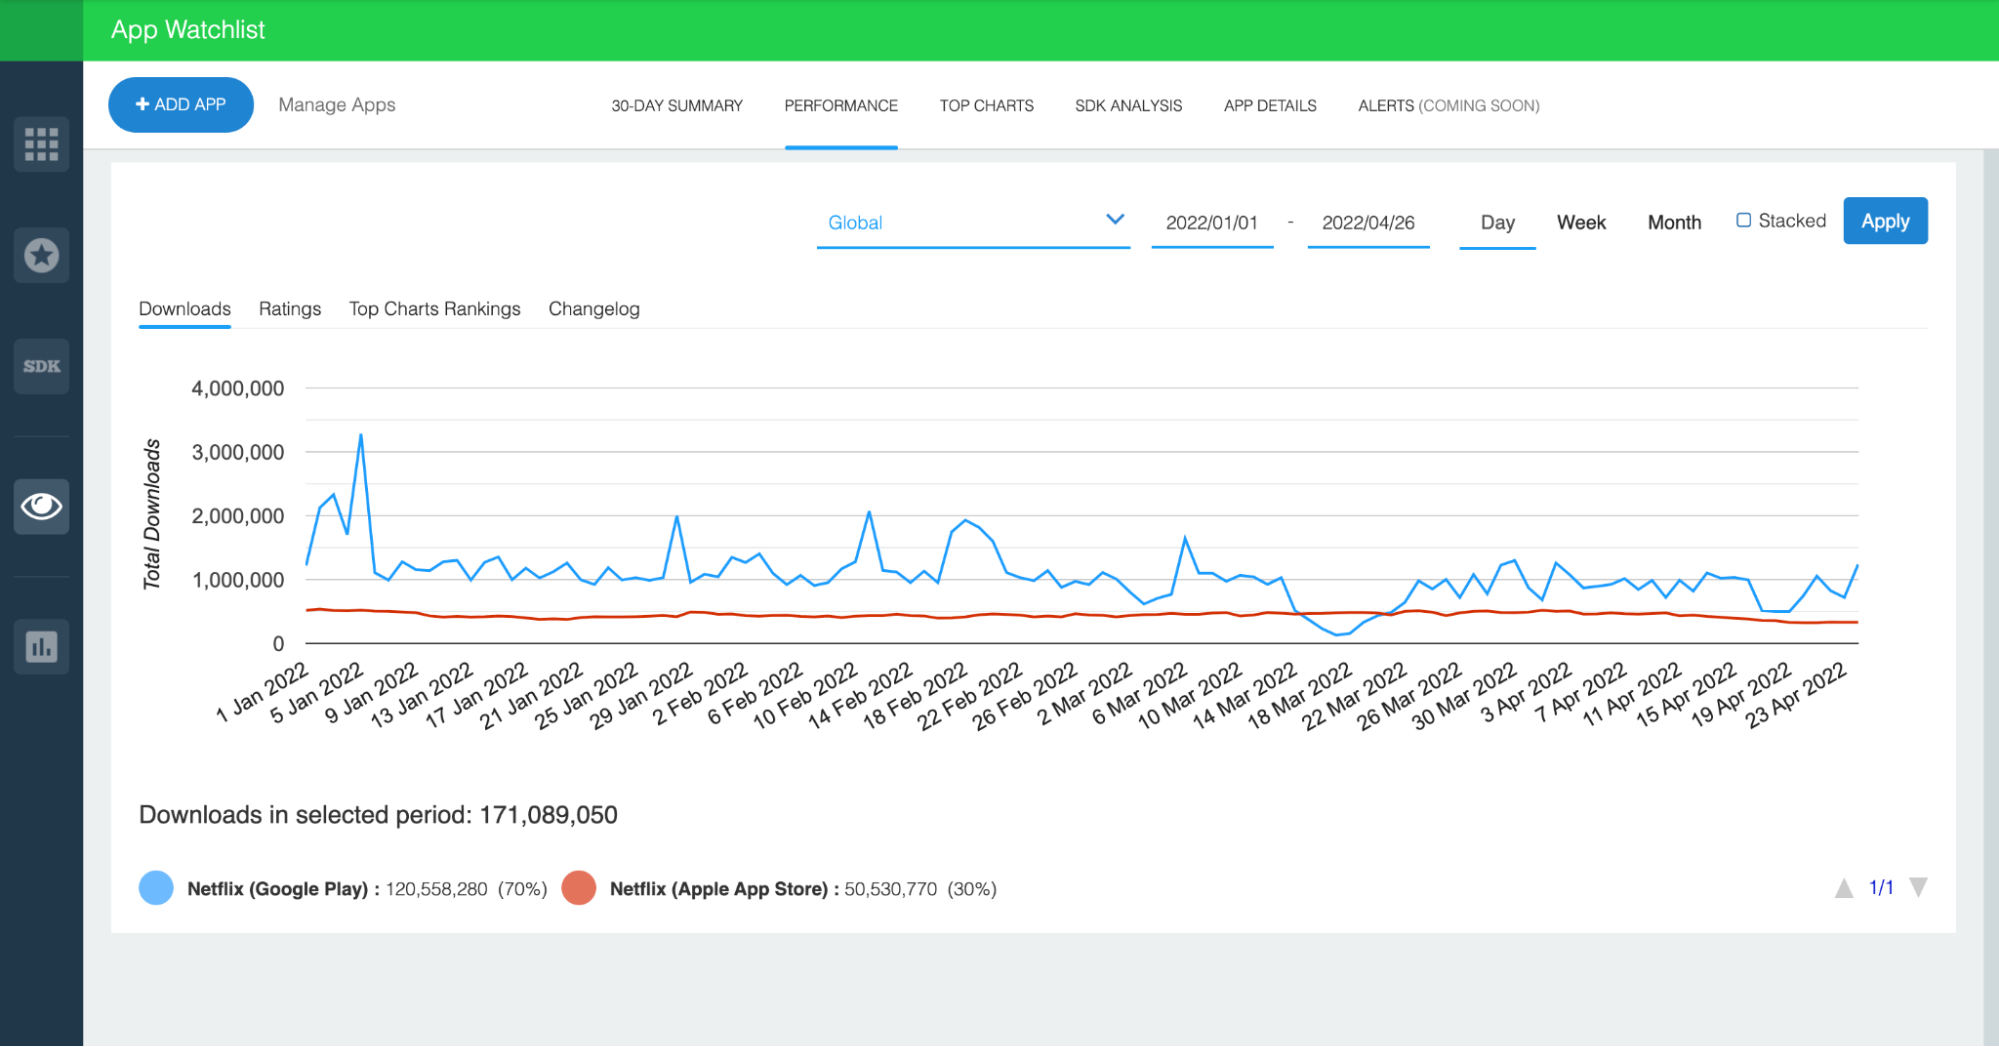
We used our App Watchlist platform to plot Netflix’s daily global downloads between January 1st, 2022 and April 26th, 2022. Here, the Android app is depicted in blue, whereas the iOS app is depicted in red.
All things considered, downloads have been fairly steady. The Android app fluctuates a little more, but typically rakes in about 1,000,000 daily downloads. The iOS app meanwhile is steadier, but generates approximately 500,000 downloads per day.
In the plotted timeframe, the Android app had by far the best single day performance, tallying 3,282,369 downloads on January 5th. The best single day for the iOS app was on January 2nd, when it hit 538,931 downloads. In total, the Android app was downloaded 120,558,280 times, whereas the iOS app was downloaded 50,530,770 times.
However, relevant to Netflix’s current struggles, there’s a marked decline in daily downloads beginning in mid-April. Not only do iOS downloads begin to dip around April 15th, but the Android version also begins to flatline a bit, with one dramatic trough lasting from April 16th until April 21st. These dates happen to line up fairly well with the company’s stock price trends:
Another interesting thing to note is that Netflix downloads clearly suffered when the company suspended services in Russia. That mid-March dip in Android downloads seems directly tied to the company’s March 6th withdrawal. Check it out, here are Netflix’s daily downloads in Russia between February 1st and April 6th:
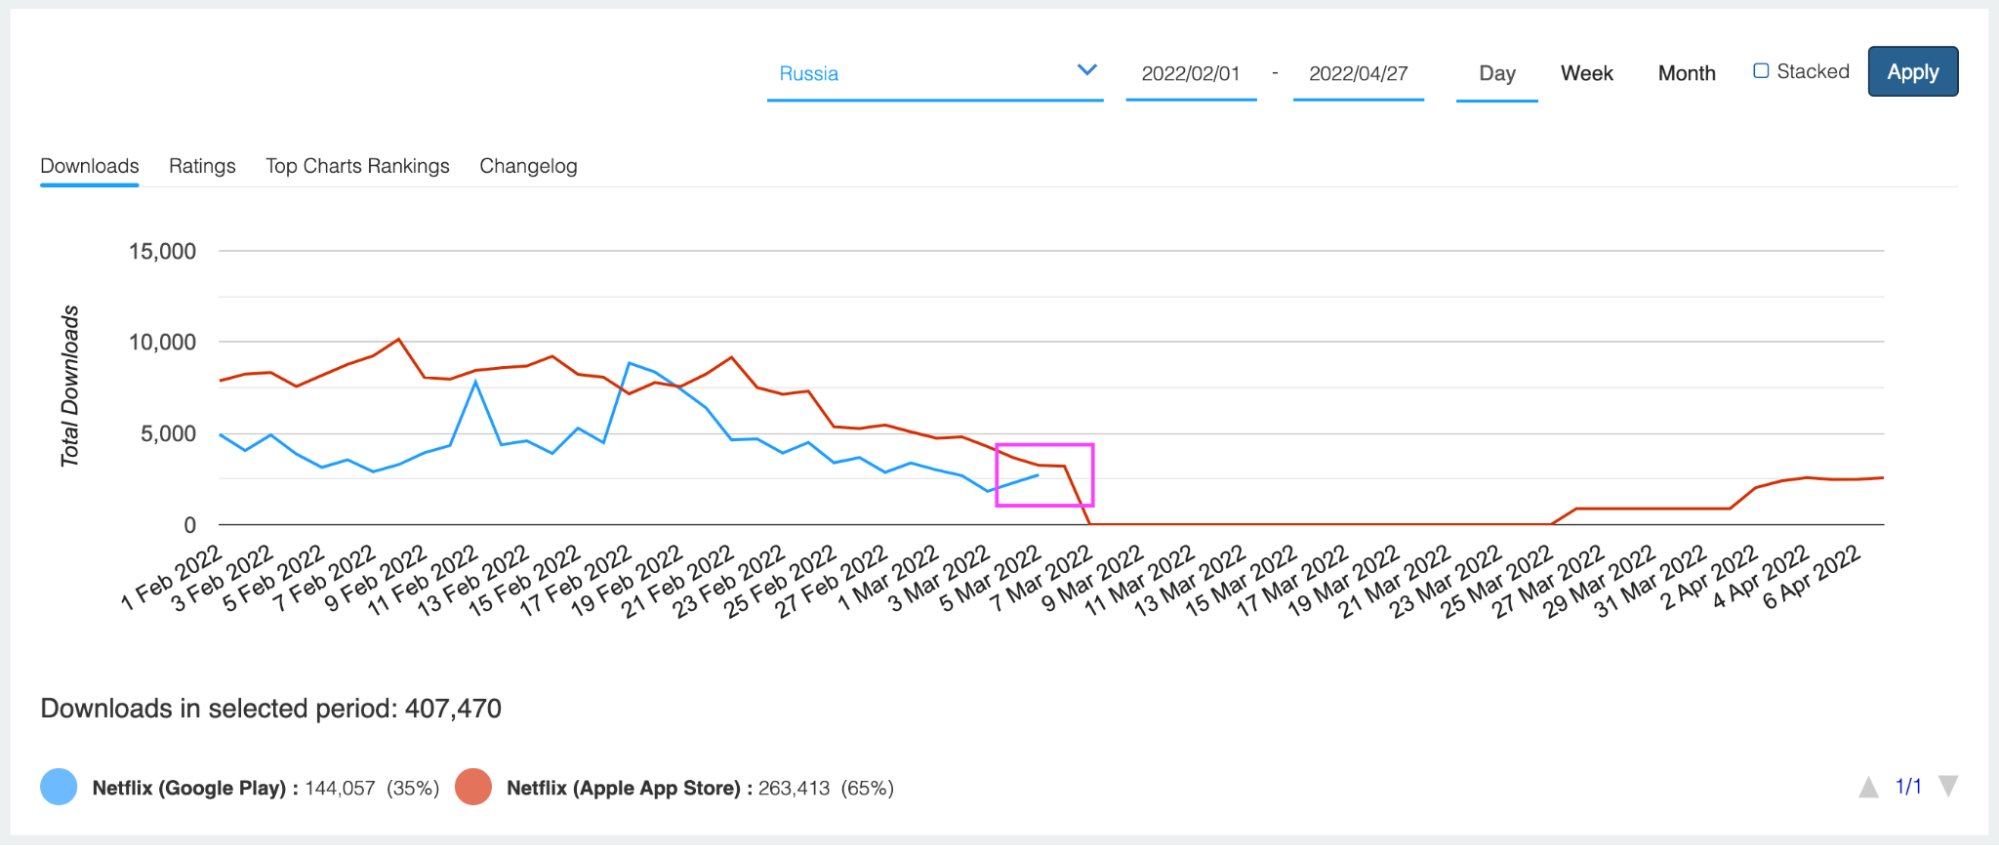
Now, all things considered, losing those 10,000 - 15,000 daily Russian downloads doesn’t seem like much for a company that typically pulls in 1.5M globally. Nevertheless, it lends some credibility to Netflix’s justification for their poor quarterly results.
Top Charts Rankings (January 1st, 2022 - April 26th, 2022)
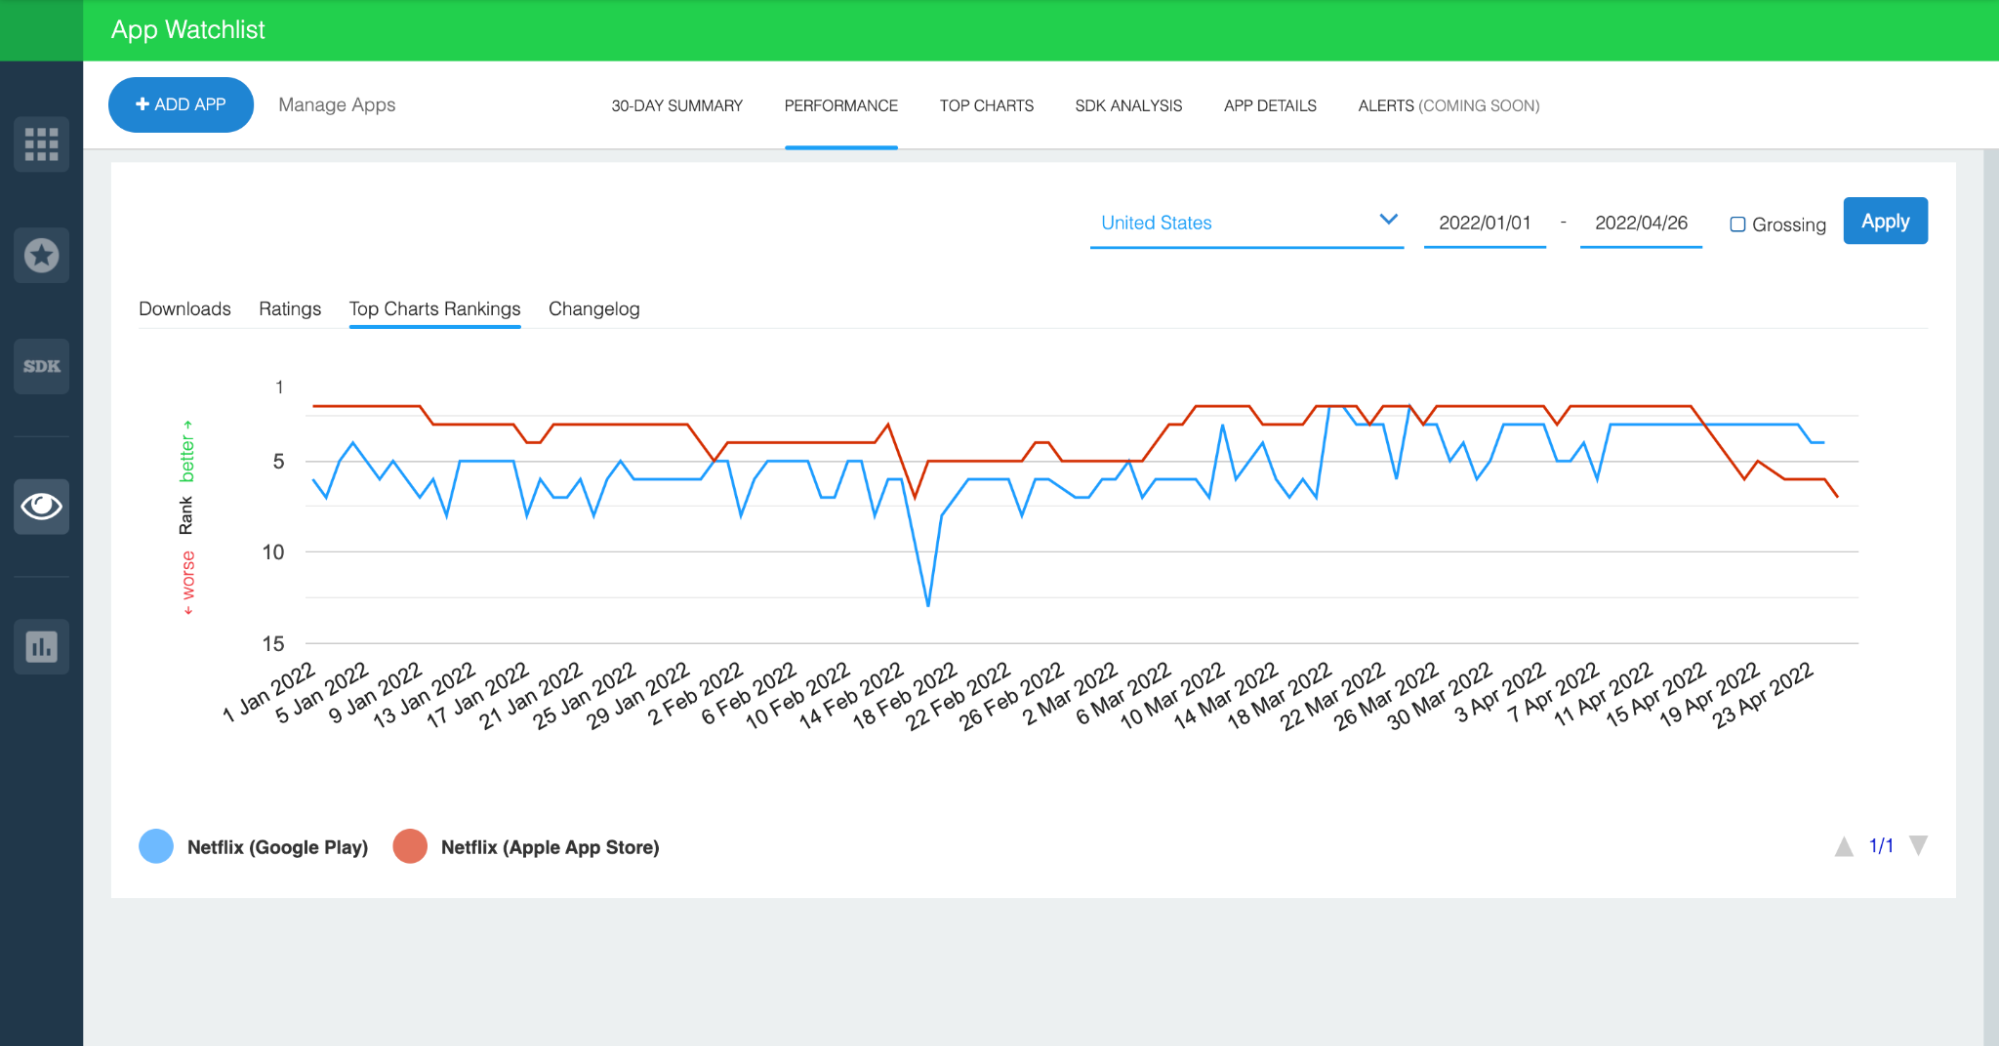
Moving on, let’s look at the top chart rankings. These tell a very similar story as the download trends. Above, you’ll find Netflix’s daily, category-specific rankings in the United States. In this case, both versions of the app fall under the “Entertainment” category / genre.
By and large, the iOS app outperformed the Android app. While both spent time ranked as high as number two in the U.S., the iOS app was consistently ranked in the top five while the Android app often fell outside the top seven. The Android app even fell as low as 13th on February 16th. Now, that’s not particularly bad, but it’s important to keep in mind that this is Netflix we’re talking about — maybe the most disruptive company in the entertainment industry over the last 20 - 30 years.
Here, it’s important to remember that top charts consider far more than just pure downloads. While Google and Apple aren’t exceedingly transparent about their ranking methodology, it’s widely understood that things like download velocity, recent downloads, ratings, reviews, and user retention matter quite a bit. That last one — user retention — is particularly interesting in the case of Netflix.
Once again, it’s hard not to notice the sudden dip at the tail end of this chart — roughly when Netflix’s stock took a dive. The Android version has been holding firm, but the iOS app tumbled to number seven in the U.S. This is remarkable because the iOS app has seldom performed so poorly. Moreover, this seems to be directly related to declining downloads since both charts depict drops beginning around mid-April.
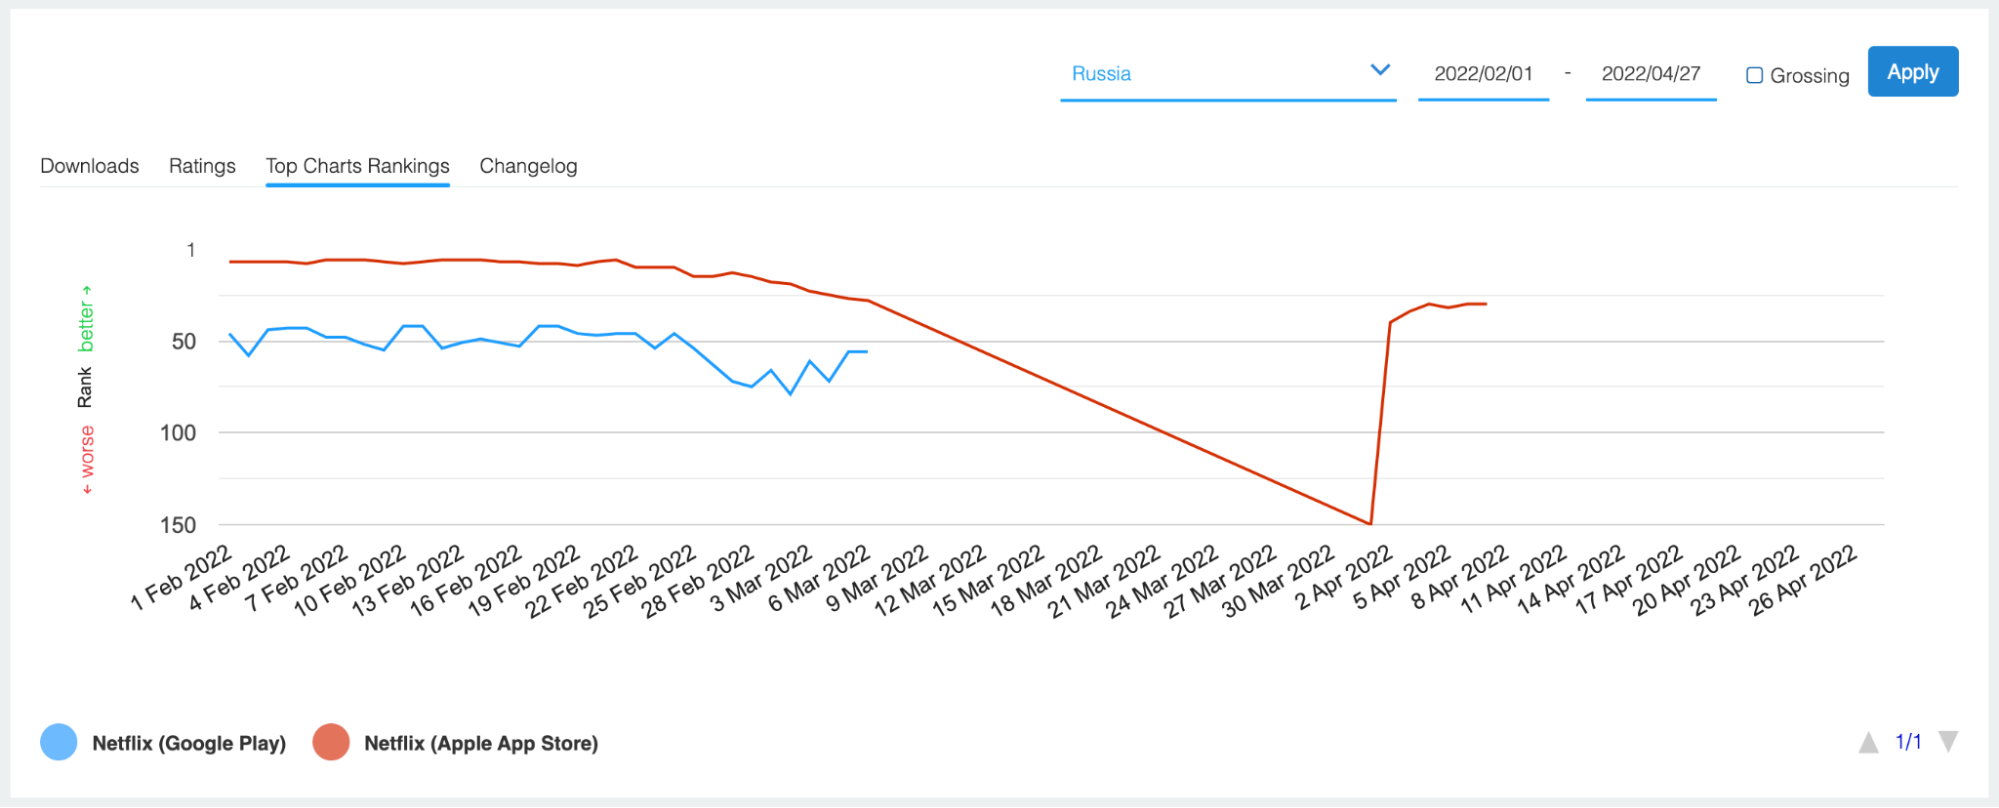
Moreover, Russia’s top charts further corroborate Netflix’s claim that pulling out of the country impacted their first quarter performance:
Final Thoughts
One of the most persistent issues Netflix has faced is profile sharing. While in the past the company encouraged households to share passwords, it recently indicated that it will begin cracking down on the practice. Likewise, in an effort to bolster revenue — and presumably to coax jilted password sharers back into the fold — the company announced it will be launching an ad-supported membership tier at a lower price point.
Now, by and large, Netflix’s stock market woes do not seem to have substantially impacted their performance in global app markets. However, a potential crusade against profile sharing and the advent of an ad-supported offering, almost certainly will. We’ll be following this story in the weeks and months to come.