This article was written by Veronika Vilgis, PhD, who works as a consultant data strategist. It uses data collected by 42matters’s app intelligence solutions to analyze how understanding the mobile app landscape can help policymakers craft better COVID policies.
The COVID-19 pandemic not only constitutes a global health crisis but has also had a major impact on socio-economic activities. Global and national efforts to address the immediate health threat have been unprecedented, with governments implementing border closures, national lockdowns, and other social distancing measures intended to limit the spread of the virus. In addition, many countries created grants to aid the rapid development of treatments and vaccines and provided financial support to mitigate the economic consequences for citizens and businesses.
However, despite these efforts, the pandemic continues to threaten global socio-economic conditions. This means governments, NGOs, and watchdogs need to remain vigilant since further intervention may be required to prevent the situation from worsening.
To better understand these risks, and to identify both prevailing economic conditions and sudden fluctuations, data is critical. Indeed, for policy makers, an awareness of socio-economic trends is crucial to formulating policies that foster inclusive, sustainable growth and alleviate the negative consequences of the pandemic (OECD, 2021).
Effective Policies Require Good Data
Numerous data initiatives have been launched to analyze the impacts of the pandemic. For instance, the COVID-19 Data Repository established by Johns Hopkins University tracks case numbers, hospitalizations, and COVID-related deaths. Additionally, privately owned data, such as Google’s mobility data, has played a vital role in informing policy around social distancing measures (Pauno &. Planes-Satorra, 2021).
However, timely and accurate data is not always easy to come by. This is particularly true of data collected from the digital economy, much of which is owned by private companies and is either not accessible to the general public or sitting behind paywalls. As such, public-private collaborations are essential for addressing challenges like the coronavirus pandemic since the data provided by private companies can help inform public policy at a granular level.
Understanding the Mobile App Economy With Data From 42matters
42matters provides a wealth of mobile app intelligence and app market insights that can help policymakers craft well-informed policy. Indeed, mobile technologies have played a critical role throughout the COVID-19 pandemic. Not only have they provided access to essential services and information, but they’ve also helped track the spread of the virus at local, national, and global levels. In particular, mobile apps and digital platforms have facilitated remote work, distance education, telemedicine, and more. Knowing how and when these technologies are adopted can therefore help policymakers identify when intervention may be necessary.
Below we leverage data from 42matters to show how focusing on a range of apps within different app categories can provide valuable insight into socio-economic trends stemming from the initial stages of the pandemic. In particular, we focus on trends in Latin America and the Caribbean, where the pandemic threatens the ability to reach the 2030 Sustainable Development Goals (United Nations, 2015).
How COVID-19 Impacted Latin America and the Caribbean
The first case of COVID-19 recorded in Latin America and the Caribbean was in March 2020. Several countries responded quickly and implemented measures, such as border closures and national lockdowns, to reduce mobility and promote social distancing. As in the rest of the world, these measures triggered both increased internet usage and greater demand for mobile applications. To monitor changes in the way people interacted with the internet, we used data collected from several key sectors likely impacted by the COVID-19 pandemic.
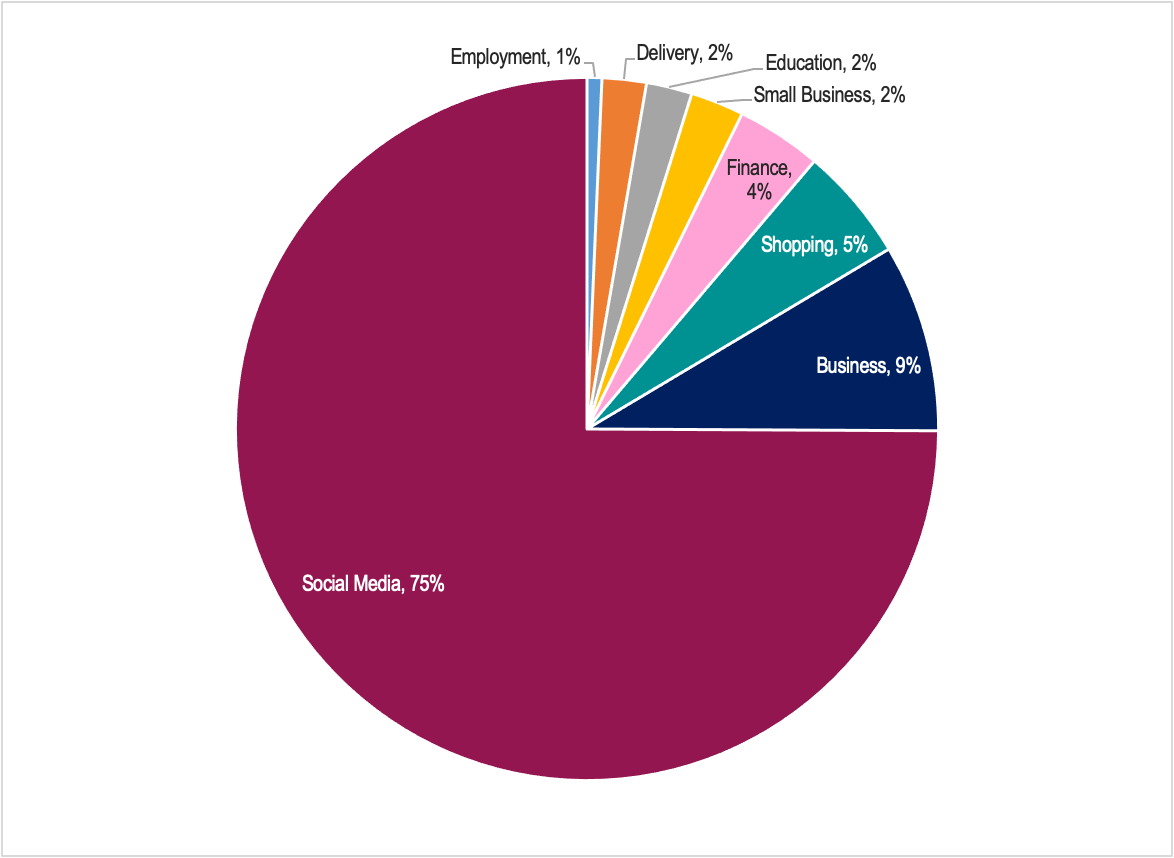
Figure 1 shows total downloads per capita for 23 countries within Latin America and the Caribbean. A peak in downloads can be seen around May / June of 2020, months after the first case was reported. This peak can mostly be traced back to the volume of social media apps downloaded during this time, when many countries had implemented border closures and national lockdowns. Social media apps account for the majority of downloads in this sample, around 75% (see Figure 2).
Figure 1: Total downloads per capita for 23 countries within Latin America and the Caribbean. The red line represents the region’s average.
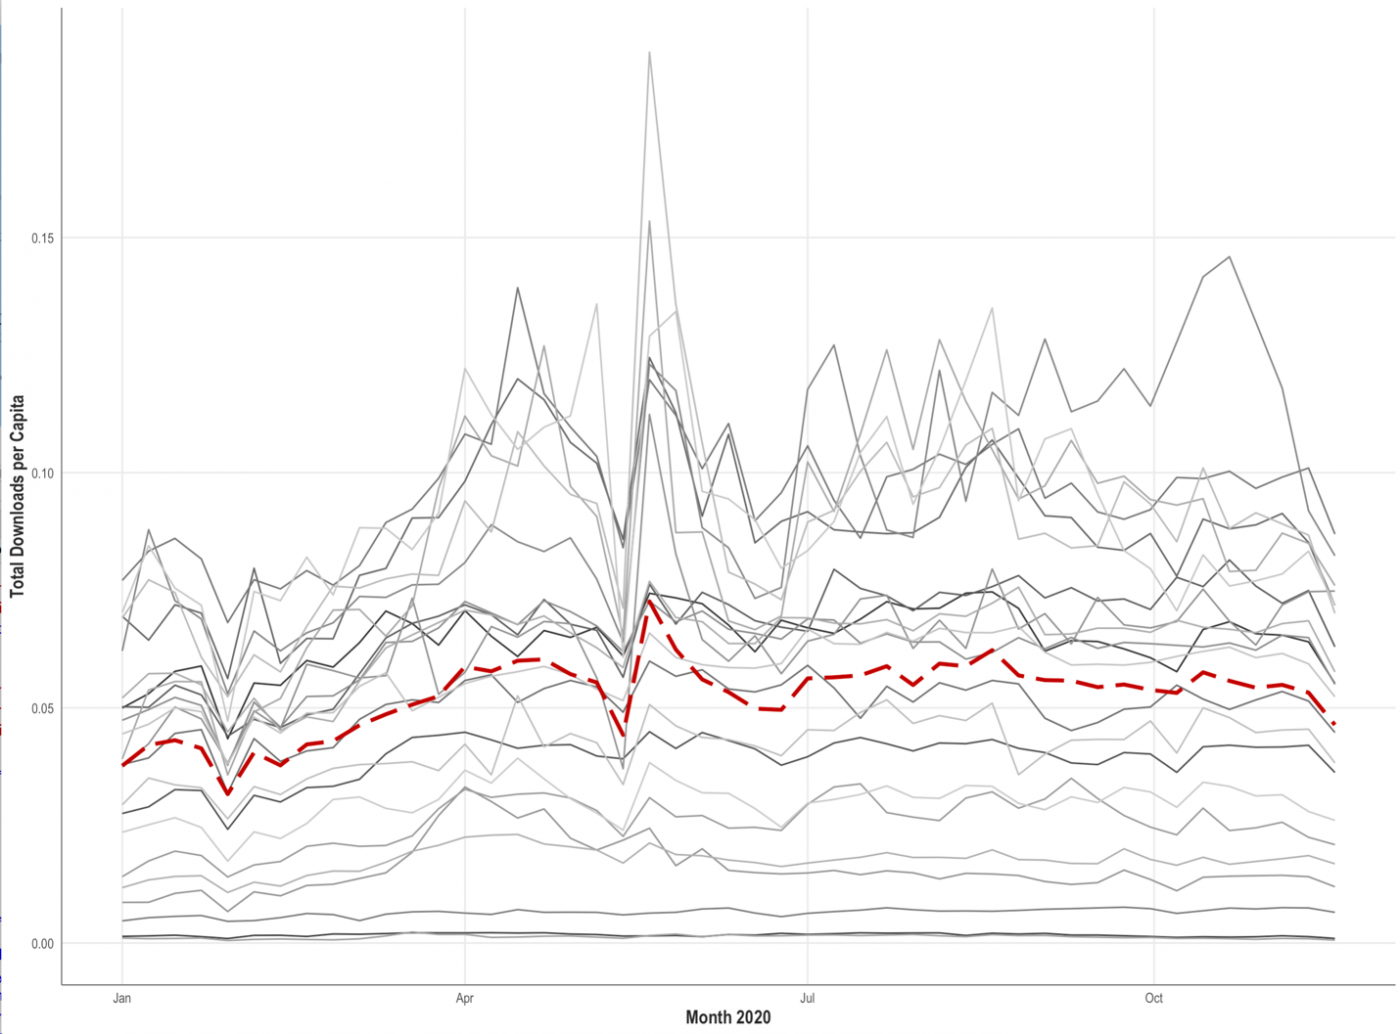
Figure 2: Distribution of downloads by category.
When we remove the social media data a slightly different picture emerges. Figure 3 shows that downloads of business-related tools, like video conferencing apps, experienced a strong increase in downloads in the first quarter of 2019. The peak was reached around April, when companies began implementing remote work measures, often prior to any national lockdowns. Equally, education providers also relied on business tools and video conferencing apps to facilitate online learning.
Figure 3: Total downloads (across countries) by App Category.
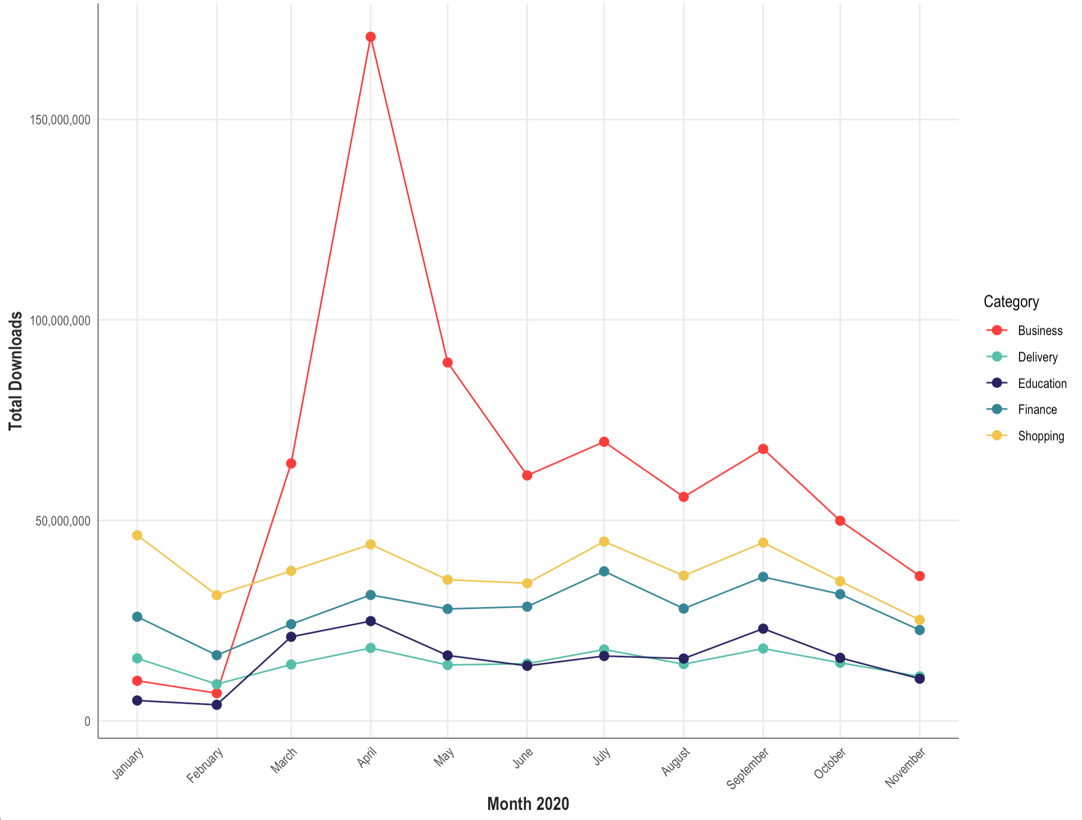
When we examine this data further, it becomes clear that download trends for specific categories were similar across numerous countries.
For example, in Argentina, Brazil, Chile, Colombia, Costa Rica, and Mexico, downloads for business tools increased at the beginning of the pandemic, while demand for employment-related apps declined. Meanwhile, data for delivery and shopping-related apps reveal an initial uptick in downloads followed by relatively high numbers as the pandemic unfolded.
Country-specific patterns are also noticeable. In Costa Rica, for instance, download rates for adult learning apps increased, peaking in July 2020. Furthermore, downloads for financial apps increased in Brazil, and there was an uptick in demand for shopping-related apps in Chile.
Figure 4: Total Downloads per capita for seven categories and six countries.
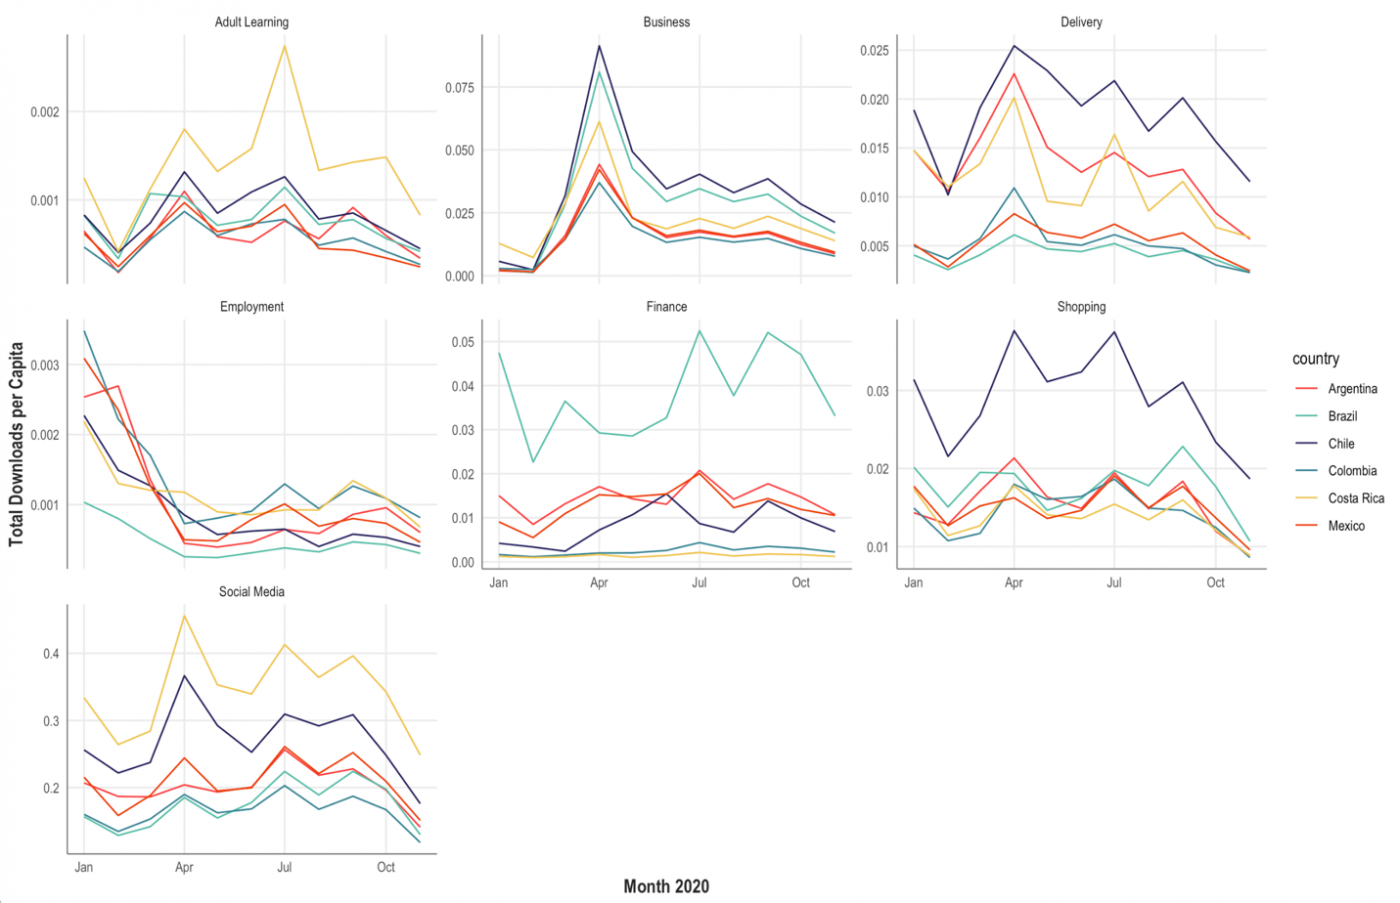
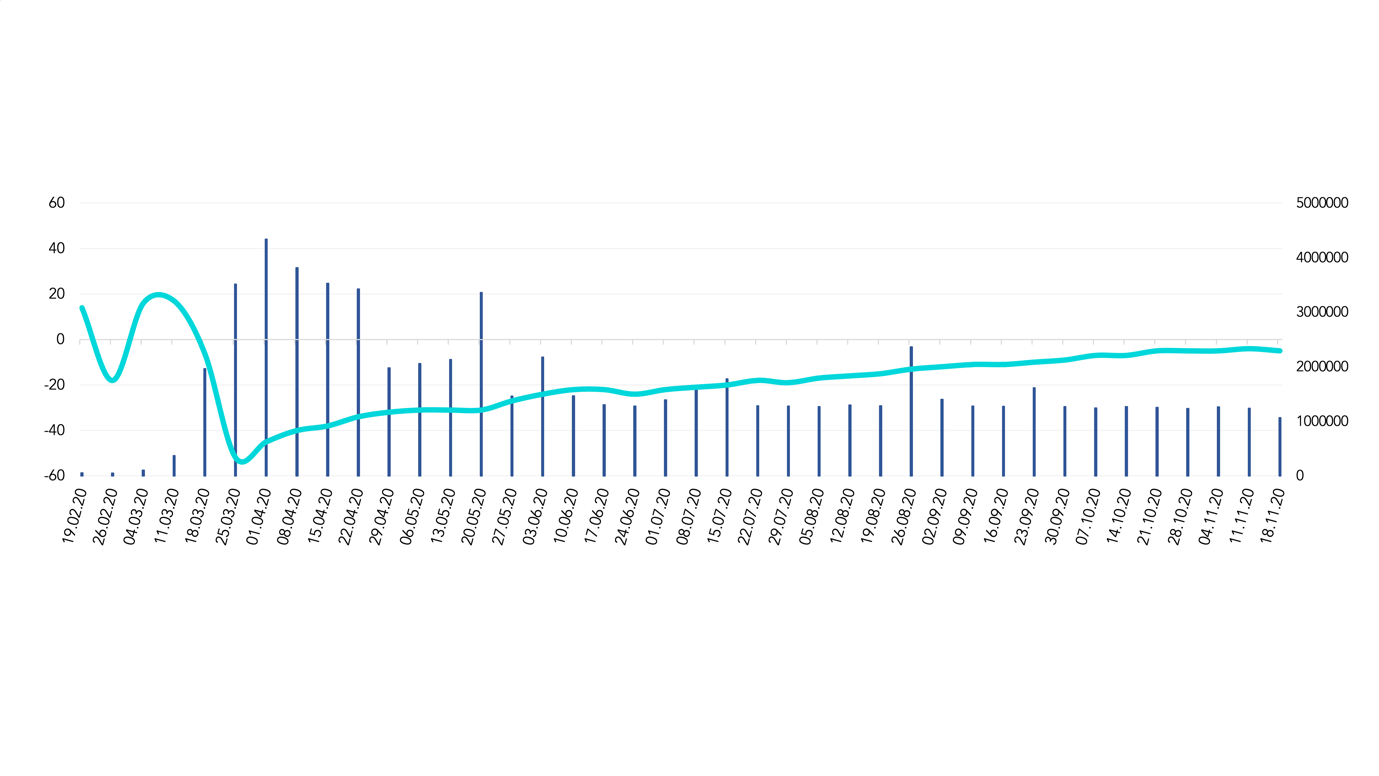
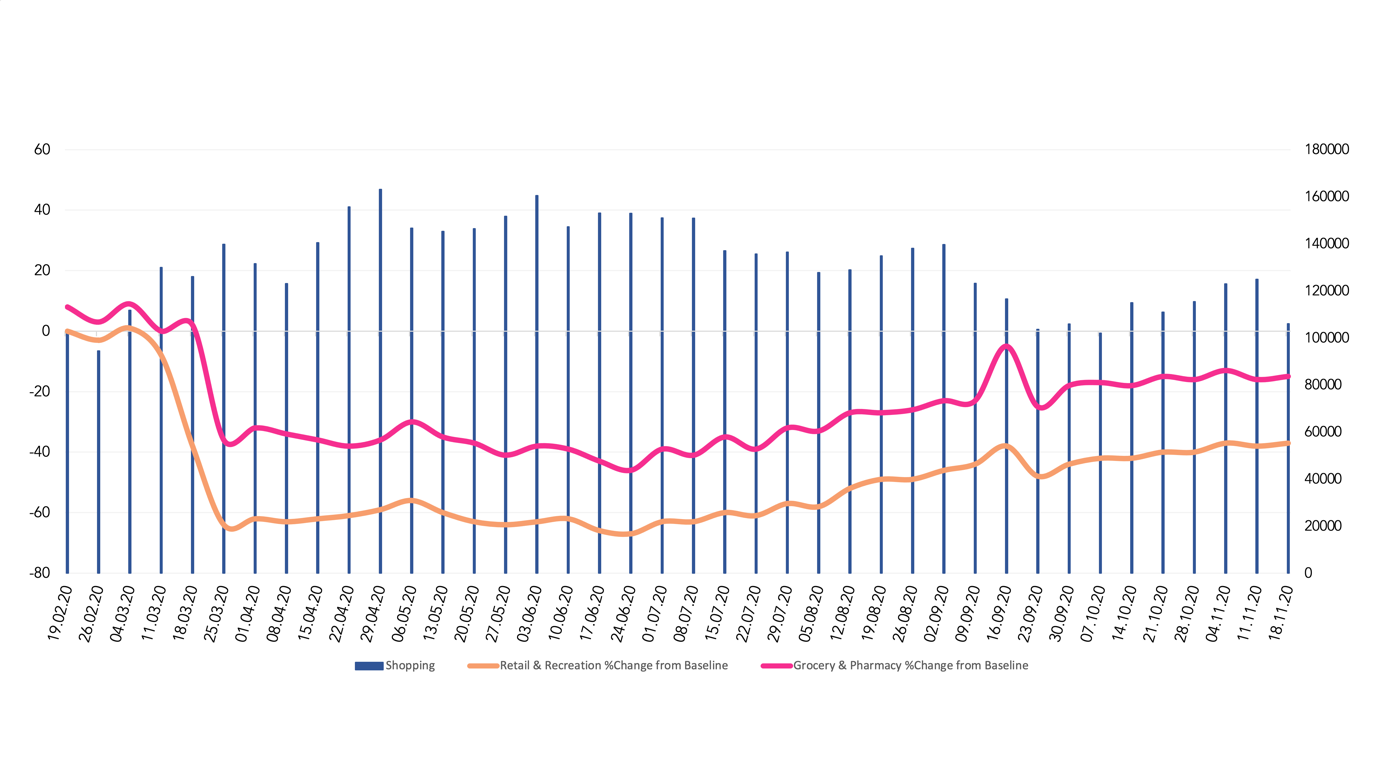
Figure 5 shows how app downloads relate to mobility patterns in Brazil, Mexico, and Chile. The left axes show Google’s mobility data as a percent change from baseline, while the right axes show total country-specific downloads.
Figure 5A confirms that as in-office work decreased, demand for business-related apps increased. Similarly, shopping-related apps and apps that enable the delivery of groceries and other consumer goods were downloaded more frequently as people spent less time in stores. This is particularly noticeable for retail stores, many of which had to close temporarily as they were deemed non-essential. In contrast, grocery and pharmacy outlets remained open in most countries. Hence, their relationship to shopping and delivery apps is weaker.
Figure 5: Mobility Patterns and Downloads for selected countries.
A: Brazil – Changes in Workplace Mobility (light blue line) and Business-Related App Downloads (blue bars)
B: Mexico – Changes in Retail & Recreation Mobility (yellow line), Grocery & Pharmacy Mobility (pink line), and Delivery-Related App Downloads (blue bars)
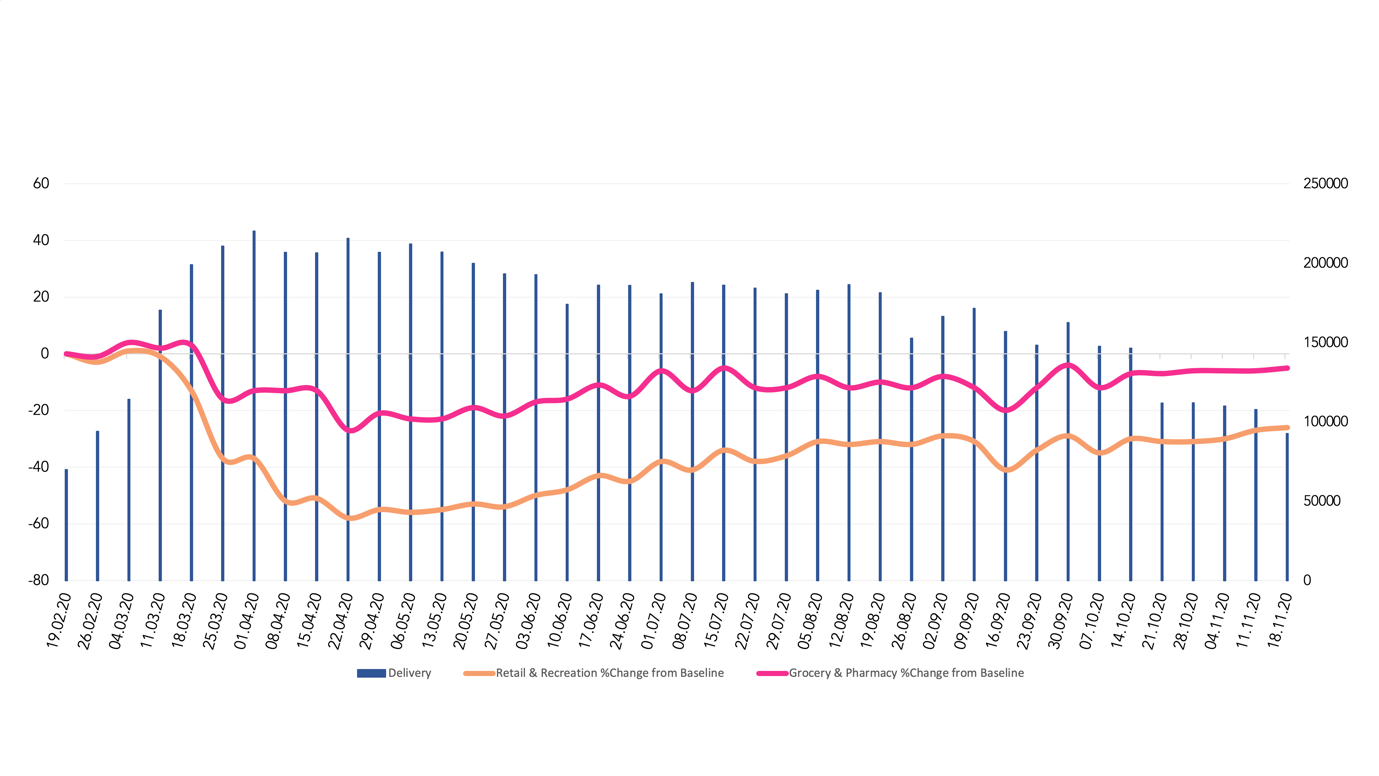
C: Chile – Changes in Retail & Recreation Mobility (yellow line), Grocery & Pharmacy Mobility (pink line), and Shopping-Related App Downloads (blue bars)
Overall, these data trends suggest that the pandemic has created a push towards carrying out more and more activities online, and that social distancing measures likely impact demand for digital apps. What’s more, coronavirus has revealed just how important connectivity has become for education, financial services, and other economic activities (CEPAL, 2020).
Even before the arrival of COVID-19, many countries in Latin America were already facing consequential digital divides, exacerbated by a number of socio-economic factors, such as income level, geographic location (urban versus rural), and gender issues. So, to limit the impact of the pandemic, policies that ensure inclusivity are necessary. They should take into consideration not only access to the internet, but also the affordability of devices needed to get online.
In addition to inspiring policies that guarantee a sustainable and inclusive economy, the pandemic has also encouraged governments to use more sophisticated digital technologies. For example, many governments have begun to leverage mobile solutions, such as virus tracking apps that facilitate contact tracing and the dissemination of government-issued health information.
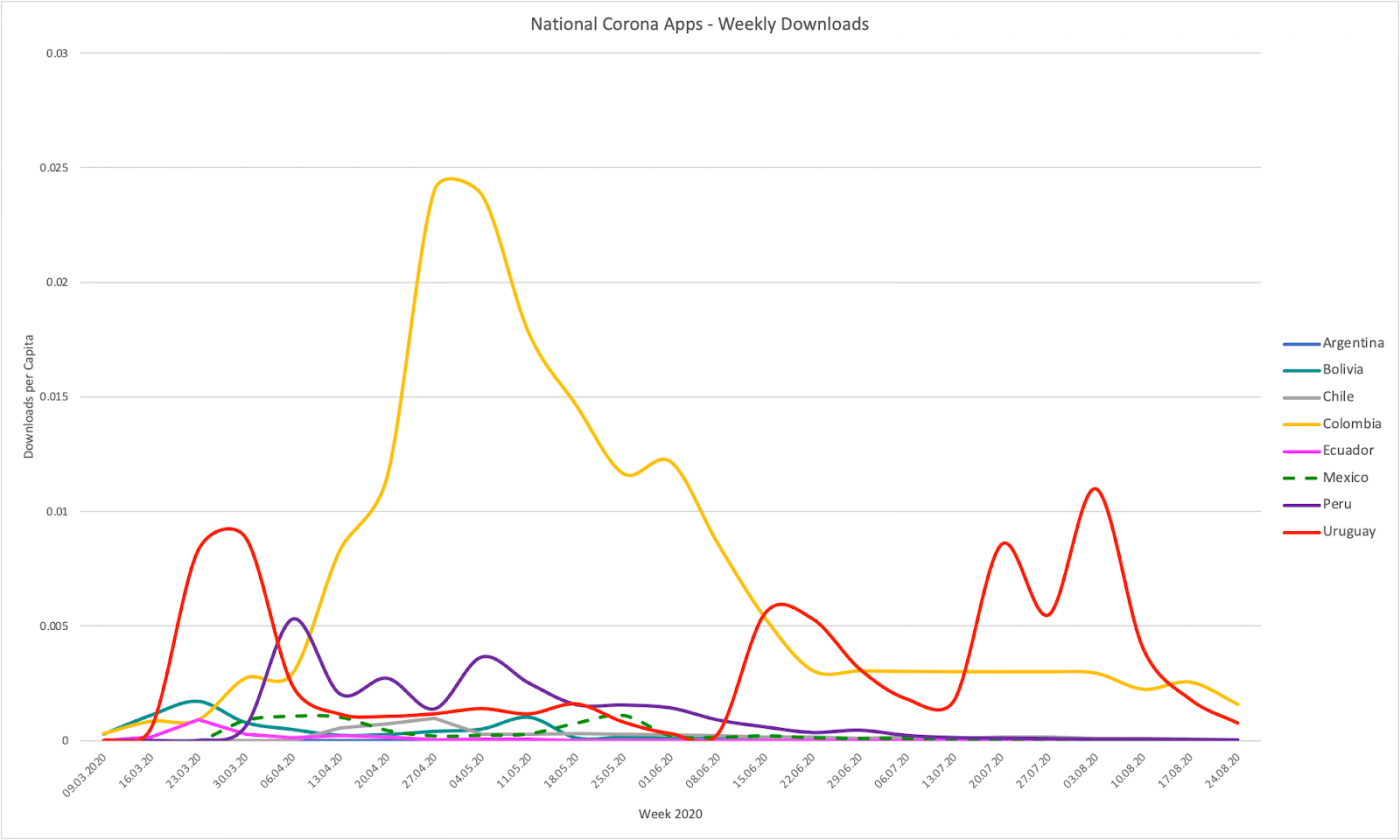
Below we track downloads for several national, government-backed COVID-19 apps in the region. Figure 5 shows that national coronavirus apps were mainly adopted in Colombia, Peru, and Uruguay. Despite their availability, such apps do not seem to be especially popular in Chile, Mexico, Bolivia, Ecuador, or Argentina.
These discrepancies highlight the need for further evaluation of the strategies employed to promote virus tracking apps within different countries. Not much is gained when governments invest in apps that are not adopted by citizens. So, understanding what encourages people to interact with their governments digitally will be important if and when future digital tools and strategies are rolled out.
Figure 5: National COVID-19 App Downloads
Final Thoughts
Data is essential for understanding socio-economic trends and it should be leveraged to help navigate and respond to societal challenges. The COVID-19 pandemic has led to a dramatic shift in how people, businesses, and governments operate online. Globally, the pandemic has accelerated digitalization and brought about changes that would have otherwise taken years.
As such, it has created a unique opportunity to advance some of the digital tools and processes that have emerged in response to the pandemic. Likewise, it has encouraged many to rethink existing practices with an eye towards creating a more sustainable and inclusive business environment.
At the same time, the pandemic has put the world in a precarious situation. It threatens to widen existing inequalities and shift power structures. In order to mitigate this, as well as to help respond to future crises, data collected from the digital and mobile world ought to be harnessed. It can play an important role in helping policymakers understand prevailing economic conditions as well as what might occur in the future. Only when we have a better understanding of this can we formulate appropriate policies and respond to crises responsibly.
References:
CEPAL (2020), Universalizar el acceso a las tecnologías digitales para enfrentar los efectos del COVID-19, August 2020 https://repositorio.cepal.org/bitstream/handle/11362/45938/4/S2000550_es.pdf
OECD (2021), OECD Science, Technology and Innovation Outlook 2021: Times of Crisis and Opportunity, OECD Publishing, Paris, https://dx.doi.org/10.1787/75f79015-en.
Paunov, C. and S. Planes-Satorra (2021), "What future for science, technology and innovation after COVID-19?", OECD Science, Technology and Industry Policy Papers, No. 107, OECD Publishing, Paris, https://doi.org/10.1787/de9eb127-en.
United Nations (2015) Resolution adopted by the General Assembly on 25 September 2015, Transforming our world: the 2030 Agenda for Sustainable Development (A/RES/70/1) https://www.un.org/ga/search/view_doc.asp?symbol=A/RES/70/1&Lang=E
About Veronika Vilgis, PhD:
Veronika Vilgis is a consultant data strategist for the United Nations Economic Commission for Latin America and the Caribbean. She has contributed to various projects that use big data analytics and unconventional data sources to gain insights into the digital economy for policy recommendations. Her work has been included in various publications including policy briefs, scientific journals, methodological guidelines and textbooks. She holds a Ph.D. from the University of Melbourne and a M.A. (Hons.) from the University of Glasgow.